
.png)
Most PD feedback forms confirm sessions went well. Few help you decide what to do next. Five swaps that fix that.
A district leader looks at last year's PD feedback report. Ninety-four percent of ratings land in the top half of every scale. The board is happy. The cabinet is happy. The data is unanimous: the PD is going well.
Now the budget cycle starts and someone asks which sessions to invest in next year. The feedback report doesn't have an answer. When everything scores at the top, nothing in the data tells you what to do differently.
We analyzed 180 form versions and five school years to find out what feedback forms are telling district leaders, and what they're missing. The short version: most forms answer one question well (did educators like the session) and several others not at all.
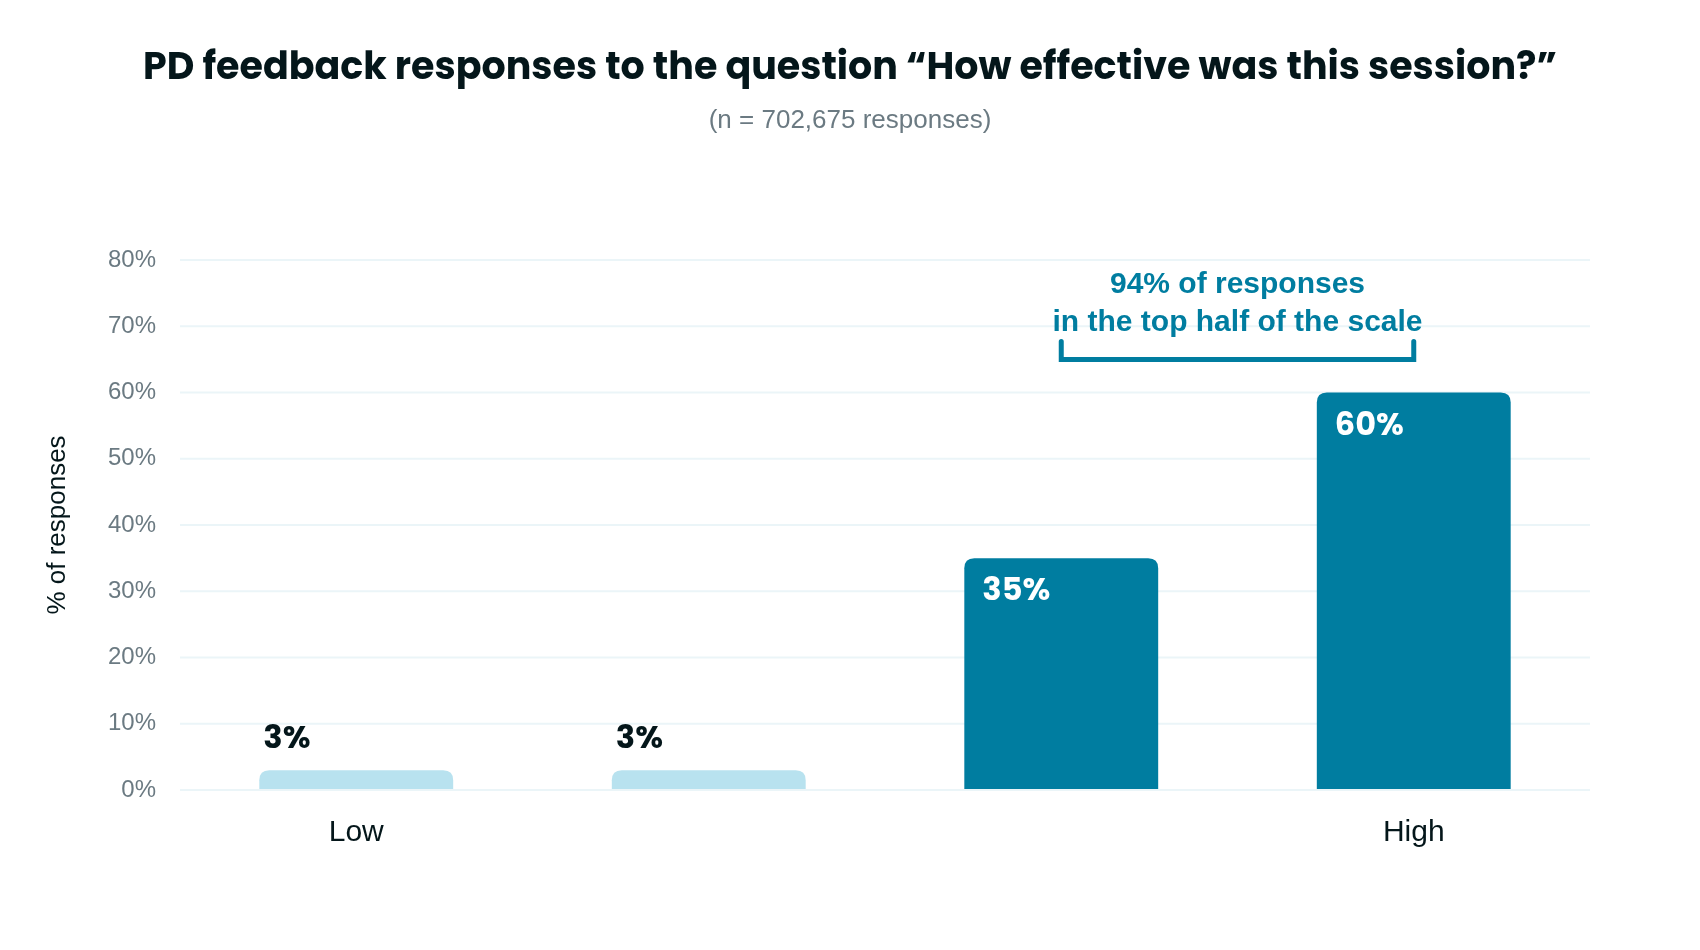
Questions about learning environment, facilitator effectiveness, and overall session quality return top scores 58% to 76% of the time. Those questions confirm PD is running well, but they make it hard to tell strong sessions from average ones. The pattern doesn't hold for every question. When educators are asked to rate their knowledge of a topic before a session, only 9.9% give the top score. When they're asked how much they learned, 26.2% do. Knowledge-tracking questions use the full scale, and they give you something you can compare from session to session.
The same problem shows up in role data. Coaches and instructional specialists rate PD 1-5 points higher than classroom teachers, across every question category and every year in the dataset. A summary score that averages those responses together hides a real signal: the same session is landing differently depending on who's in the room. When educators leave negative comments about content, the most common pattern is that the session didn't connect to their role.
The average open-response question is left blank by 60% of respondents. Adding more open responses doesn't help. Respondents write fewer words per question as the count goes up.
What does help is wording. Generic prompts like "Additional comments" or "Describe any barriers" come back blank 75-87% of the time. Specific, forward-looking prompts like "What's one specific takeaway?" or "How will this impact your students?" come back blank 2-3% of the time. Same educators, completely different rates, just from changing the question.
None of this requires a longer form. The fix is swapping questions that confirm what you already know for ones that surface something you don't.
Methodology: Analysis of 702,675 feedback responses from KickUp client districts across 180 form versions, covering school years 2020-21 through 2024-25. Ratings were normalized to a 0-100 scale to allow comparison across forms with different scale lengths. Questions across all forms were grouped into semantic categories using AI-assisted classification (Claude claude-haiku-4-5-20251001). Open response blank rates and word counts were calculated across the full dataset. Open response themes extracted from a stratified sample of 10,000 responses using AI-assisted classification.
Schedule a demo with one of our friendly team members.

.png)