
.png)
KickUp Dashboards let you pull coaching, walkthroughs, PD, and evaluation data into a single, customizable view — without leaving the platform or touching a spreadsheet.
It's the night before a cabinet meeting. Walkthrough data is in one system. Coaching logs are somewhere else. PD completion is in a spreadsheet someone sent last week. You need to show whether your support strategies are working — and instead of answering that question, you're copying and pasting until 10pm.
Most districts don't have a data problem. They have a “where is it all” problem.
It's a challenge we’ve heard consistently from our partners — from small districts to some of the most complex we work with. With coaching, mentoring, walkthroughs, professional development, and evaluation all happening across so many pockets of an organization, keeping a pulse on what's actually happening — and whether it's making a difference — is harder than it should be.
That's what KickUp Dashboards were built to solve.
KickUp Dashboards let you pull together anything captured in KickUp — walks, coaching sessions, PD participation, evaluation data — into a single, visual display that updates in real time.
The builder is drag-and-drop. No IT request, and no waiting on someone to run a report. You choose what you want to see, arrange it to tell a coherent story, and it stays current as new data comes in. Add headers and section labels to make it readable for any audience — your own leadership team, a principal meeting, or a board presentation.
The real value is being able to put the right data next to each other – and sort and drill-in in an instant. A few examples of what that looks like:
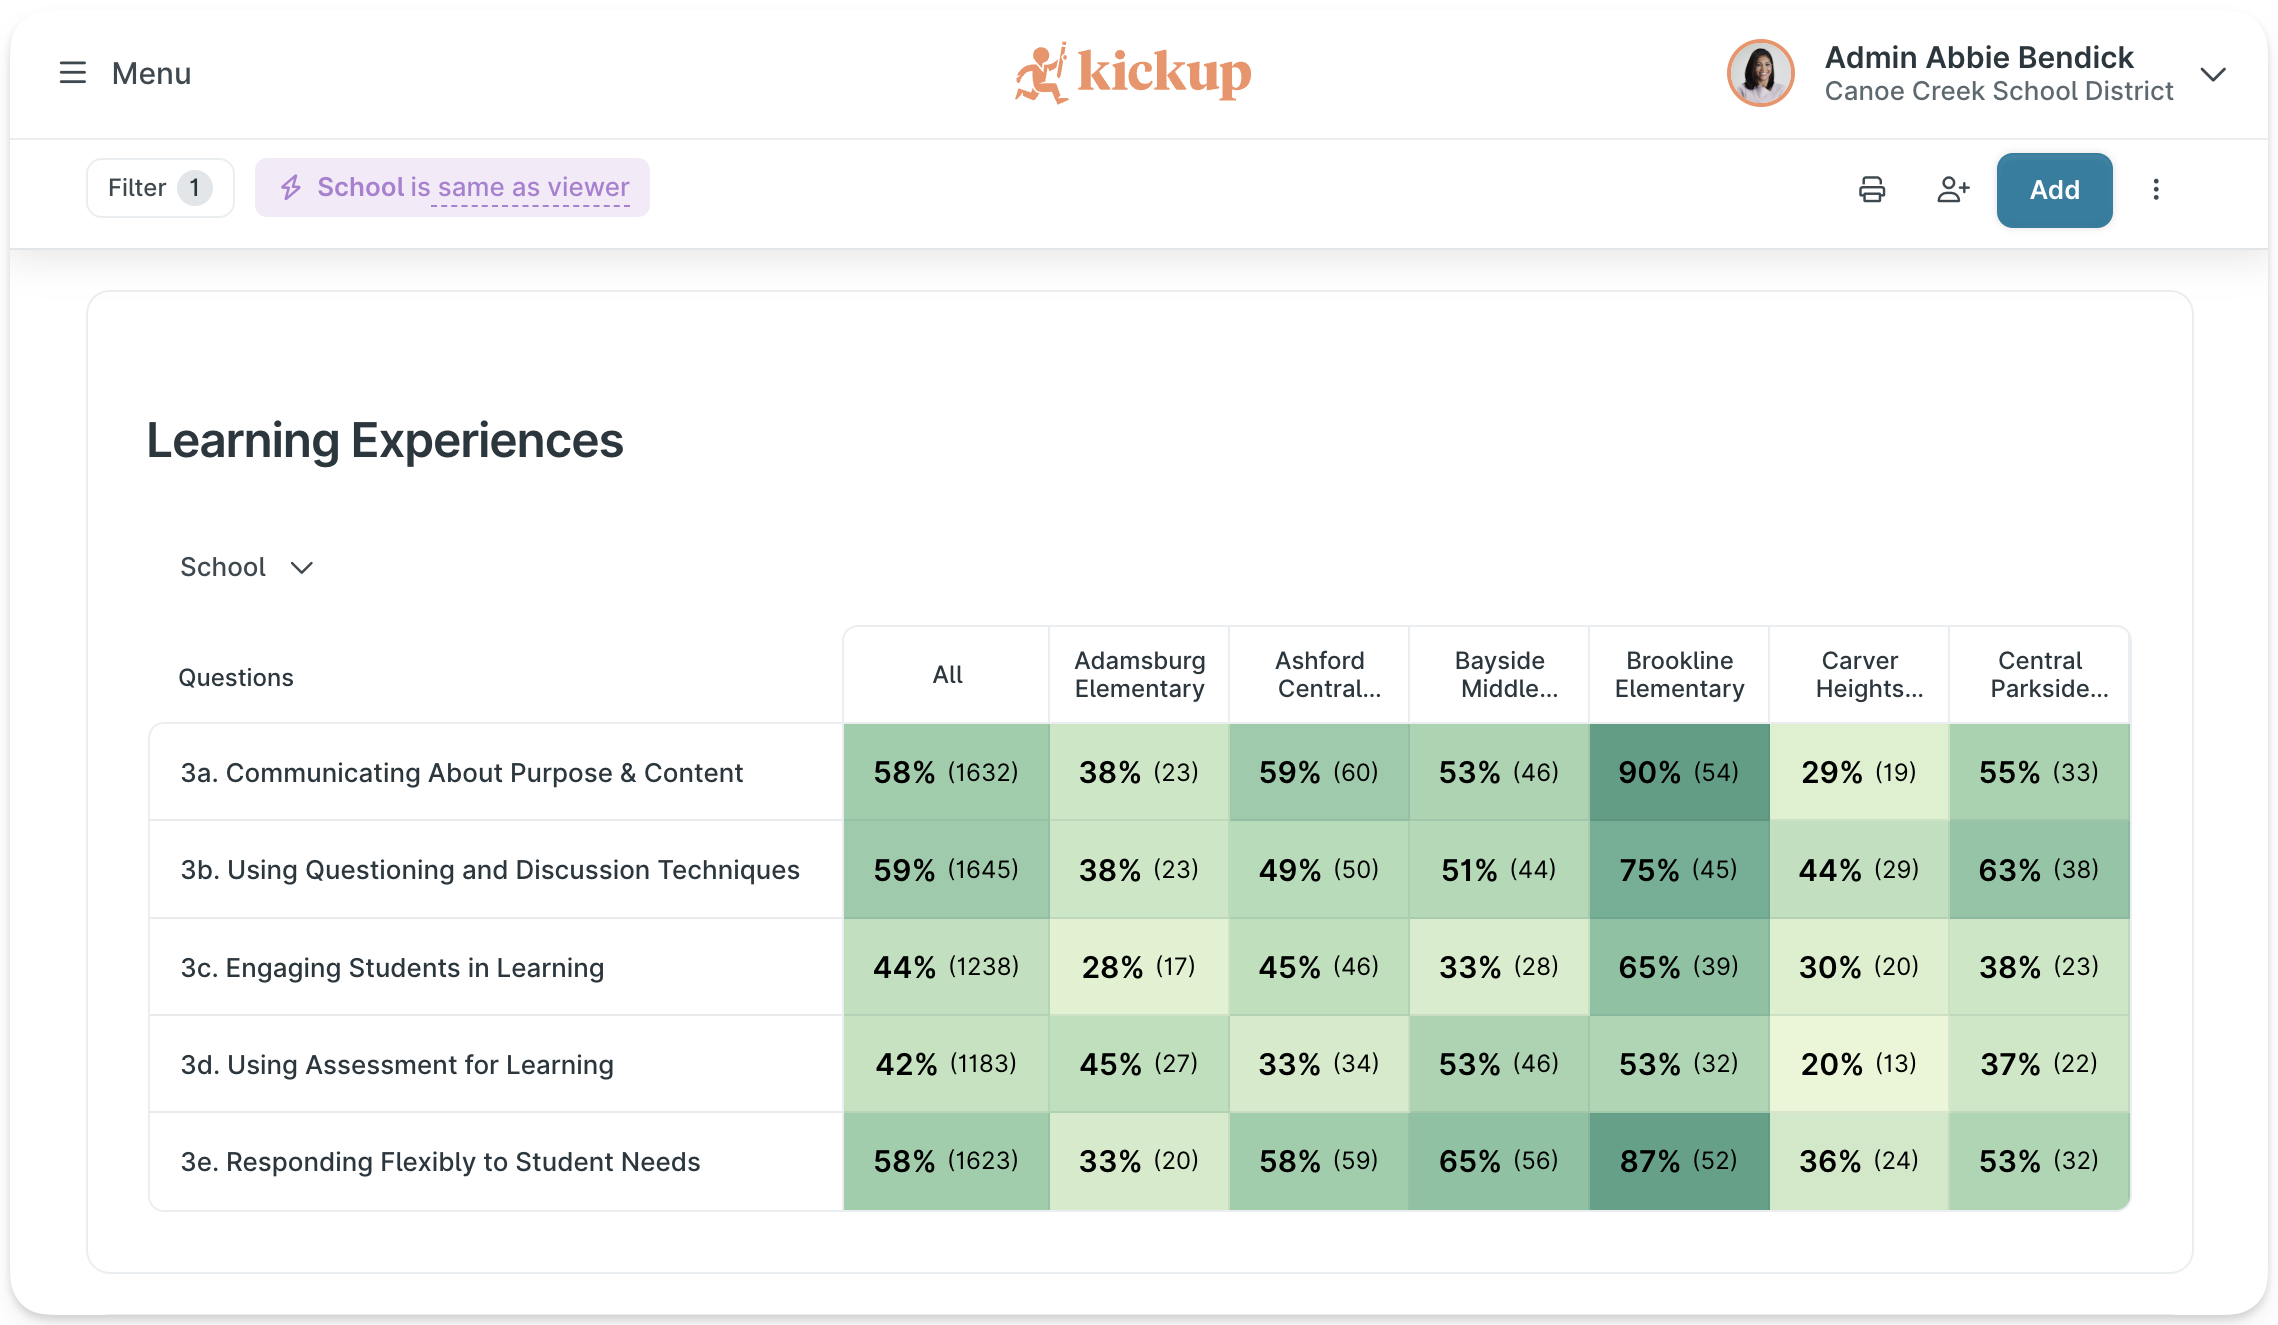
Start with your walkthrough data. Scan across schools and see which instructional practices are strong and which ones keep showing up as areas of need — before those patterns end up as surprises in a summative evaluation.
Place that walkthrough data alongside coaching logs and you can see immediately whether your investment is landing where the need is — or whether there's a gap worth a conversation.

Break down participation by framework component or strategic priority area. It's the kind of view that makes a board presentation go from hand-wavy to concrete.

Examine how your most critical Walks metrics are moving over time.
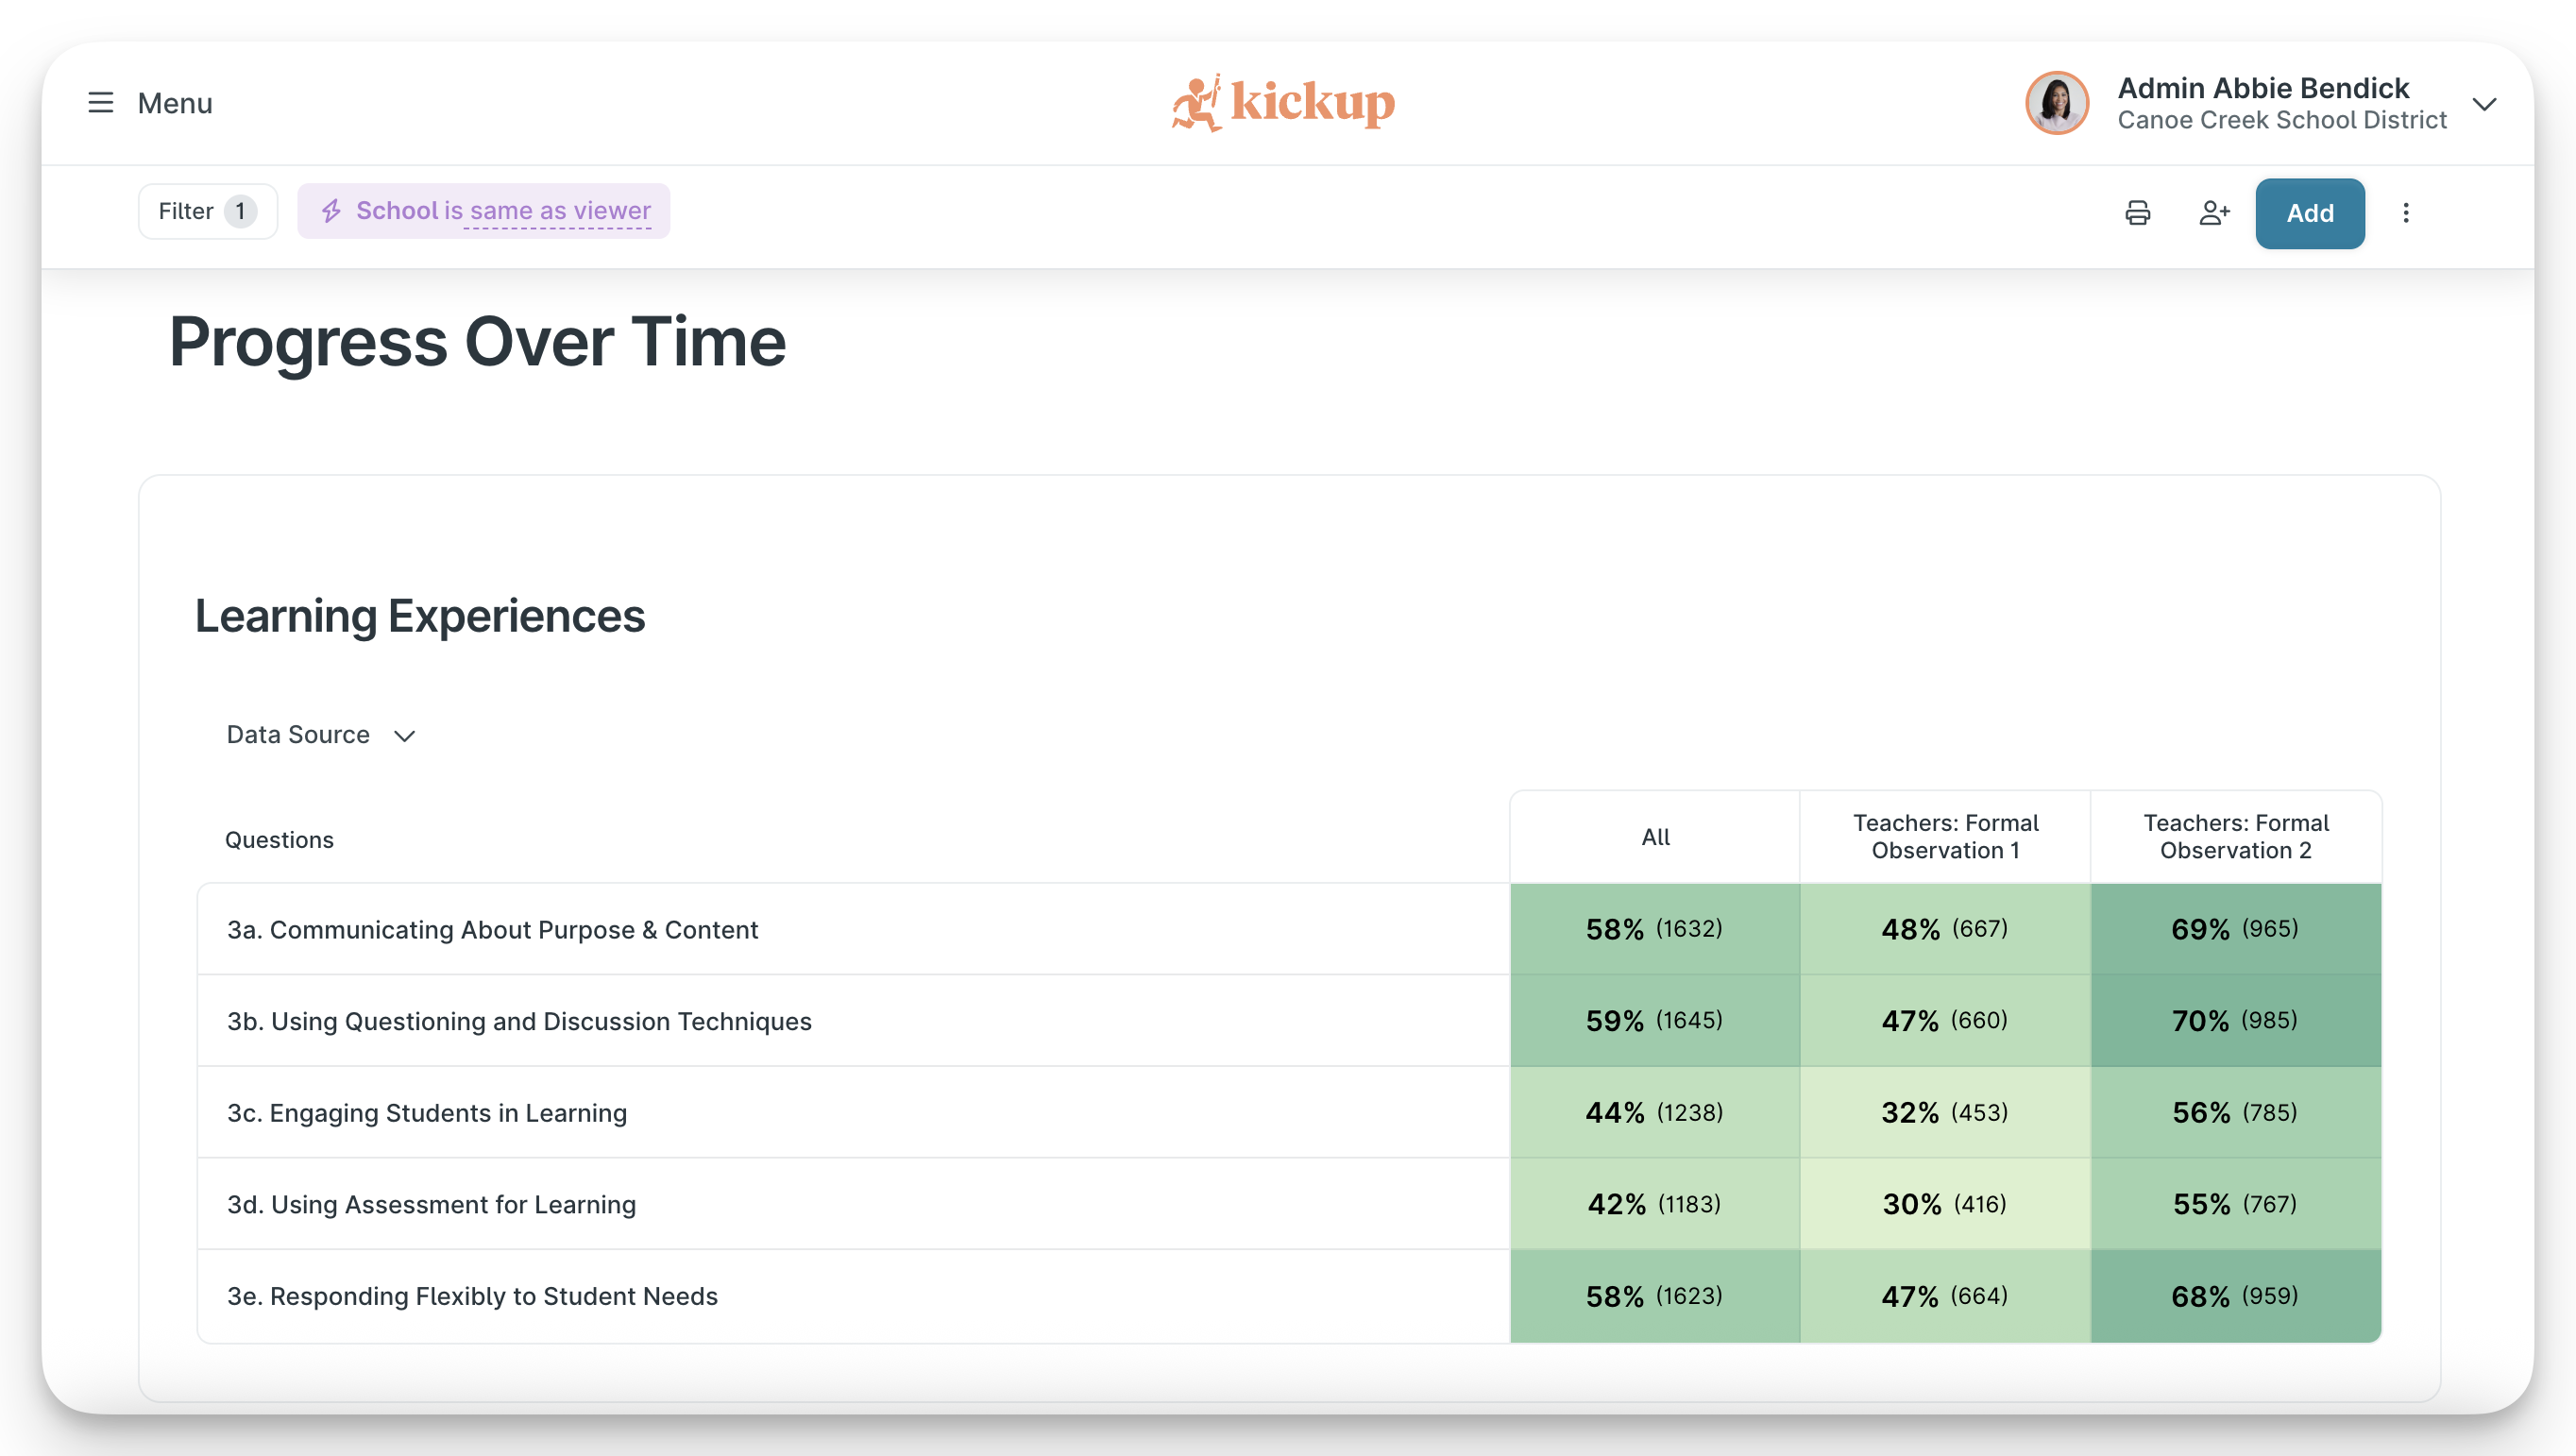
Put Fall and Spring observation data side by side, with coaching and PD in the same view. Not as an annual report — as a regular leadership check-in.
Take it from one district using it this way: a leadership team tracking a curriculum rollout built a single dashboard combining classroom walk data, coaching sessions, and PD participation — all filtered to that initiative. Instead of pulling three separate reports before each monthly check-in, the story was already there. Updated in real time. Ready to discuss.
Most platforms treat analytics as an extra — something you pay more for, or export elsewhere to access. Because coaching, walkthroughs, PD, and evaluation are all unified in KickUp, your dashboard can tell a complete story without any manual assembly. The data is already there, already connected, and already current.
"It's been a remarkable change. KickUp lets us align on priorities and action plans almost instantly, which leads to faster impact on student achievement."

That's what becomes possible when you're not spending Sunday night stitching together spreadsheets.
Schedule a demo with one of our friendly team members.

.png)