
.png)
KickUp heatmaps surface district-wide patterns instantly — and let you click into any data point to see the context behind it, without ever leaving the platform.
In 2024, Temple ISD was staring down a projected D rating from the Texas Education Agency. By 2025, 9 out of 12 campuses had improved their accountability rating. What changed wasn't the amount of data they had. It was how deeply they could see into it.
Their walkthrough data had looked encouraging — 80% of teachers implementing strong practices. But student achievement sat at 30-40%. Nobody could see deeply enough into the data to ask the right questions. Principals were marking "student engagement" as evident, but different administrators had entirely different definitions of what that meant.
That changed when Temple started using KickUp Dashboards to monitor campus improvement plans in real time — conducting over 4,200 classroom walkthroughs across 15 campuses and connecting that data to professional development and evaluation. The tool that made it possible isn't magic. It's the ability to move from a district-wide pattern to classroom-level detail in the same meeting, in a few clicks.
When a district leader opens a KickUp Dashboard, the data is visual and scannable by design. One of the most powerful views districts use is the heatmap — a color-coded, interactive grid that makes patterns immediately visible across schools, grade levels, departments, or any other dimension that matters to your district.
Which instructional practices are consistently strong? Which ones keep showing up as areas of need? The pattern is just there. And because you can regroup the view instantly — by school, by grade level, by years of experience, by department — the same heatmap can answer several different questions without a separate report request.
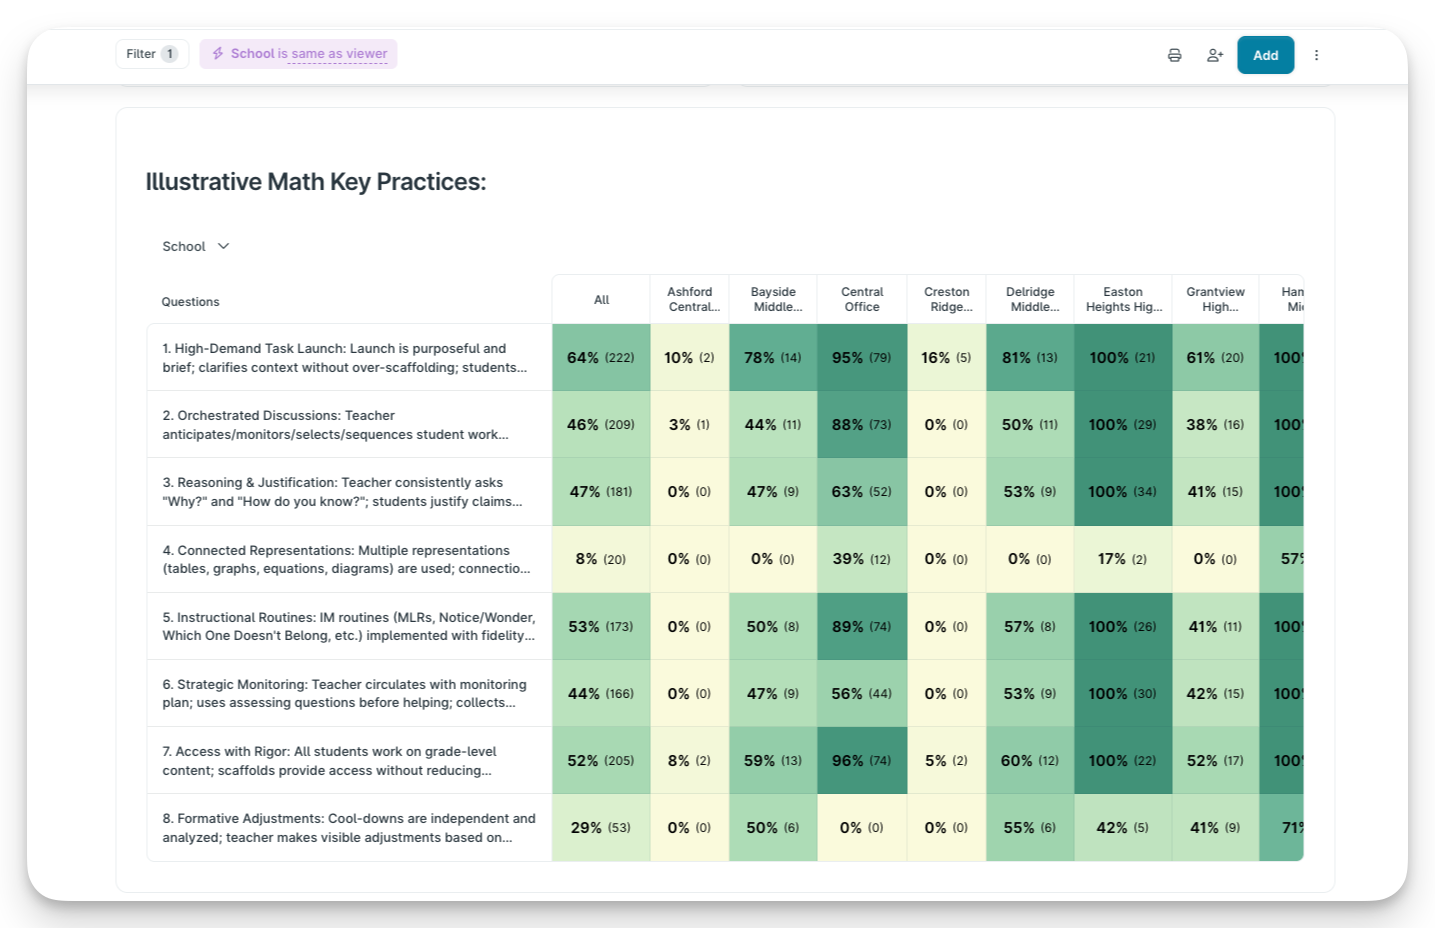
In KickUp, you click on it.
Any data point — any bar in a chart, any cell on a heatmap — is a doorway into the context and data behind it. Click a school showing lower proficiency and you see the individual walkthrough submissions from that building. Click a completion rate and you see exactly which teachers haven't finished. Click a coaching total and you see the specific sessions behind it.
You never hit a dead end. You go from a district-wide pattern to classroom-level detail in a few clicks.
Temple's Chief Academic Officer, Dr. Renota Rogers, describes exactly what this looked like in practice:
"Our walkthrough data showed the vast majority of teachers were implementing strong practices. But student achievement was starkly lower. We realized we were affirming practices at a surface level without examining whether they were actually moving the needle for students. That's when we knew we had to fundamentally change how we monitored our plans."

That's not a question you can ask from a summary report. It's a question you ask when the data is live in front of you and you can drill into it in real time.
The depth of questioning changes when you don't have to wait for a follow-up report. Temple's monthly campus meetings shifted from general check-ins to concrete, evidence-based conversations: "You've completed 150 walkthroughs — that's great. But it's February and you've only done 10 since January. What's happening?" Or: "She's had three consecutive walkthroughs marked 'not evident' for aggressive monitoring. Have you had a coaching conversation with her?"
Leaders couldn't hide behind surface-level celebrations. The data was right there — and so was the next question.
That's what heatmaps and drill-in capability make possible. Not just a better report. A fundamentally different kind of leadership conversation.
Schedule a demo with one of our friendly team members.

.png)